
KEY TAKEAWAYS
- A hike and an oil spike, but equities held. The Fed’s first hike in over three years and surging Brent, while the Nasdaq gained 1.93% and the S&P 500 finished roughly flat.
- Yields are at extremes. US 2-year and 10-year yields hit 4.88% and 5.28%, and gold and silver fell 8.54% and 6.55%. We expect yields to reverse in the short term, which would help AI-exposed names.
- Bond volatility is the one to watch. Cross-asset volatility is still low, but bond volatility picked up meaningfully. It feeds into currencies through funding rates, into credits through spread, and into the VIX once low stock correlations fade into Q3 earnings.
Market Overview
Historically a volatile period for global markets, September lived up to its reputation this year, dominated by macro catalysts including surging Brent crude prices and the Federal Reserve’s first interest rate hike in over three years. Despite these headwinds, US equities demonstrated remarkable resilience—the Nasdaq Composite gained 1.93%, while the S&P 500 ended the month largely flat. Conversely, fixed income markets experienced a sharp sell-off following the FOMC decision; US 2-year and 10-year Treasury yields surged to pre-Global Financial Crisis (GFC) highs of 4.88% and 5.28%, respectively. This sudden shift in rate expectations exerted significant pressure on yield-sensitive assets, driving gold and silver down by 8.54% and 6.55%.[1]
The Volatility
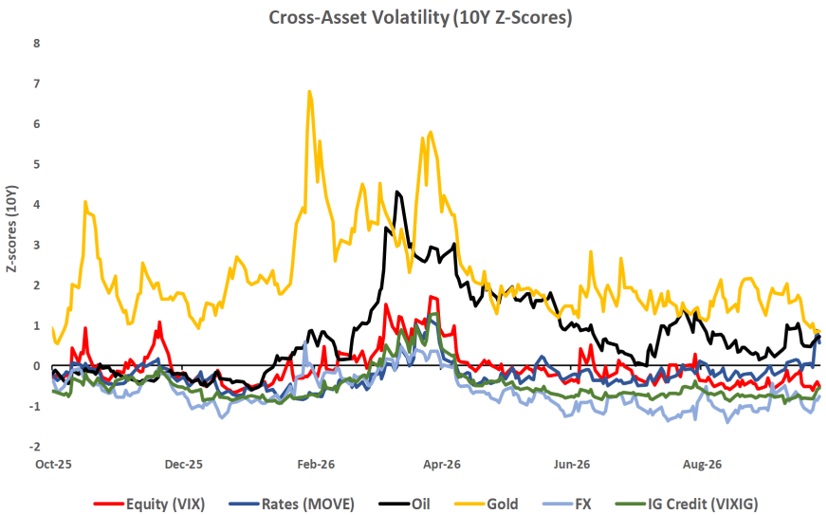
Volatility in markets has managed to trend downwards over the last year or two despite a litany of exogenous risks and tape shocks. Chart 1 shows how various asset class implied volatilities are trading relative to their own history, using a 10-year lookback. The volatilities are ranked by z-scores, which compares the current volatility level for an asset versus its own 10-year history. A z-score of +2, for example, would mean that the current volatility level is trading 2 standard deviations above its long-term average (i.e. rich) while a z-score of -2 would mean it’s trading 2 standard deviations below average(i.e. cheap). Because each asset class volatility trades at different levels and often defined differently (e.g. lognormal vs. normal vol, price vs. bps vol), by standardizing using z-scores, we are able to compare different asset class volatilities on the same scale and see at a glance if there are any divergences or dislocations in the cross-asset volatility markets.
As seen in the chart, cross-asset volatility is relatively low, but bond volatility has picked up meaningfully in September as yields continue their ascent. Bond volatility is a vector of risk to all other asset classes. Currencies become more volatile as funding rates become less certain, credit is affected as it trades as a spread over government borrowing costs, while the VIX is at the mercy of low index correlation in stocks, which won’t last as bond vol rises especially when we are closer to Q3 earnings.
More importantly, this comes under the backdrop of weakening and negative excess liquidity, as inflation has been taking away money growth. Asset prices are more prone to a higher volatility regime. We find good risk-reward in structures such as long vol certificates (i.e. directly long realized volatility), call warrant on vol (long implied volatility asymmetrically), and principal protected note with long call.
Chart 1: Cross-Asset Volatility Snapshot (10Y lookback)[2]
Positioning
In the current environment where rates are elevated and volatility is tepid, we recommend principal protected notes or minimum redemption notes. This includes range accruals on low vol FX pairs such as USD/HKD, and collar notes on precious metal. In addition, US yields are at extremes, we expect to see reversal on yields in the short term. This will be beneficial for risky assets such as AI – exposed names.
[1] Performance is sourced from Bloomberg, dated as of September 30, 2026.
[2] Source: CBOE
Disclaimer
The information presented here is intended for Accredited or Institutional Investors only and it does not constitute a recommendation to anyone; it also has not taken into account the specific investment objectives, financial situation or particular needs of any particular person. Information herein is based on sources we believe to be accurate and reliable as at the date it was made. We reserve the right to revise any information herein at any time without notice. No offer or solicitation to buy or sell securities, funds or products and no investment advice or recommendation is made herein. In making investment decisions, investors should not rely solely on this advertisement but should seek independent professional advice. However, if you choose not to seek professional advice, you should consider the suitability of the investment for yourself. Past performance of the fund manager, portfolios, and the funds are not indicative of future performance.
Investment involves risks including the possible loss of principal amount invested and risks associated with investment in emerging and less developed markets. The fund manager, portfolios, and the funds may invest in illiquid instruments, financial derivative instruments and/or structured products and be subject to various risks (including counterparty, liquidity, credit and market risks etc.). Investing in fixed income instruments (if applicable) may expose investors to various risks, including but not limited to creditworthiness, interest rate, liquidity and restricted flexibility risks. Changes to the economic environment and market conditions may affect these risks, resulting in an adverse effect to the value of the investment. During periods of rising nominal interest rates, the values of fixed income instruments (including short positions with respect to fixed income instruments) are generally expected to decline. Conversely, during periods of declining interest rates, the values are generally expected to rise. Liquidity risk may possibly delay or prevent account withdrawals or redemptions. Environmental, Social and Governance (ESG) strategies consider factors beyond traditional financial information to select securities or eliminate exposure which could result in relative investment performance deviating from other strategies or broad market benchmarks. Past performance, or any prediction, projection or forecast, is not indicative of future performance. The duplication, publication, extraction, or transmission of the contents, irrespective of the form is not permitted, except for the case of explicit permission by Aevitas Capital Management Pte. Ltd. This advertisement has not been reviewed by the Monetary Authority of Singapore (MAS).